Financial Analysis on Amazon.com
I. Amazon.com Inc Financial Performance
Amazon.com Inc is the largest online retail company founded by Jeff Bezos in 1995. Today the company has more than a $100 billion market capitalization with aggressive global expansion efforts paving the way for online shopping convenience with the use of cloud computing technology. The key advantages of the company are being able to offer products at a lower price compared to market value. This has allowed them to penetrate different market segments especially with the expansion of products and services (Chaffey, 2011).
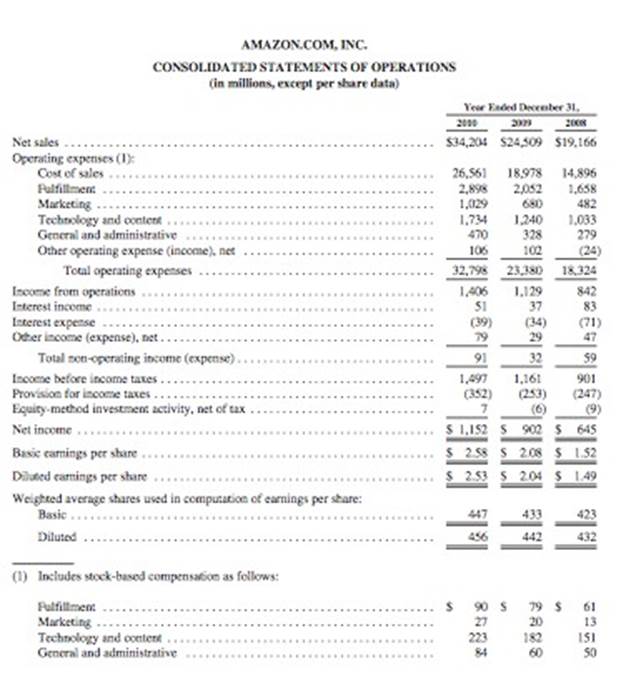
The success of Amazon’s business model is evident in its revenues wherein total revenues have increased in the past three years from $19 billion to $34 billion USD. This indicates a strong market growth solidifying their status as an industry leader in the field of e-commerce. The makes use of a direct to consumer e-commerce model that supports their inventory management. In general this has reduced their risk exposure in the past three years by removing granularity risks as they keep smaller inventories of items and establishment of warehousing facilities worldwide. As such, the company’s logistics are strategically planned enabling them to gain gross profits of $4.56 billion to $8.21 billion USD from 2008 to 2010 (Amazon, 2011).
These financial indicators have illustrated a nearly 50% increase in as short as three years, which is significant feat in spite of the global recession. The company’s free cash flows from 2008 to 2010 was $1.7 billion to $3.5 billion USD that indicates the high liquidity as compared to their net income of $654 million to $1.15 billion in the same period. As such, the company has been able to balance its inflows and outflows with a notable decline compared to capital expenditures from $333 million USD to $979 million USD. This translates to more prudent expansion efforts compared to perceived corporate actions. Amazon in fact has been applying cost saving measures while at the same time increasing profit revenues (Amazon, 2011).
This implies that the company has diversified its business prior to the global recession allowing them to have already engaged in expansion efforts ahead of competitors. The categorical expansion of Amazon has been to focus on international markets that are beyond North America and Europe. Moreover, the company has capitalized in technology such as ebooks, music and videos wherein these are the major revenue streams of the company. Significantly by expanding their product lines as well this has allowed them to be a full time online retailer wherein even grocery shopping can be quickly accomplished. The financial performance of the company in the past three years is based on their presence in the European and Asian markets since the beginning of the new millennium (Revsine, 2011).
These are non-saturated markets allowing them to have new profit streams. Moreover, the company has also included a third party seller facility that allows other vendors to sell through their website. In this way, smaller companies are able to sell and avail of the logistical and technological support of Amazon. This has reduced Amazon’s risk exposure by more than forty percent and has allowed them to generate more cost savings in the past three years. Third party sellers also pay Amazon a commission for products sold creating a winwin solution (Revsine, 2011).
This has allowed Amazon to achieve a sustainable enterprise through strategic expansion and even business diversification such as holding a variety of web services technologies that utilize their e-commerce platform sales. Moreover, the own other websites such as Clickriver.com., Askville.com and Alexa.com. In this manner, the company has been able to efficiently manage its balance sheet the past three years with total assets increasing from $16.9 to $19 billion USD. In the same period a manageable liabilities have been incurred showing a slow increase from $9.54 to only $11.3 billion USD ascertaining proper financial forecasting and planning by the company indicating a strong and stable financial performance (Amazon, 2011).
- Amazon.com Inc Stock Performance
Amazon.com is a publicly traded company enabling it to have high market capitalization as their stocks are traded in the Nasdaq, Nasdaq-100 and S&P 500 component. Its current total equity as of 2010 is $6.86 billion USD as the company has released both preferred and common stocks to the market. The preferred stocks, which was only sold in 2010 was 500 million shares with a value of $.01. For the past three years the company has continuously sold common stocks or shares that has been increasing from 435 to 461 million. The increase was most notable in 2009 with the acquisition of Zappos after which the company has subsequently repurchased common stock shares the highest of which was $100 million in 2008. This would allow the company to consolidate shareholder control over their equities (Amazon, 2011).
It has also generated more interest in their stocks especially due to their outstanding performance. This is because of the recognition of non-cash gains using the equity method investment activity. The current stock price is above 218, with high chances of increase at nearly 1.2%. The company’s financial performance has positively impacted their stocks as revenue growth is classified as very high at 41.6%. This is above the industry average wherein the Price to Earnings ratio is 114 and Price to Book at 12.8; both of are deemed by analysts as very high. Return on Assets is at 5.6%, Return on Equities is at 12.3% and EBITDA is at 48.2, all these are also very high indicators as well. As such, the stock performance of the company in the past three years has been consistent with EBIT figures increasing from $972 million to $1.54 billion between the years 2008 to 2010 (Forbes, 2011).
As such on average the company has posted 20.5% in return on equity with a gross profit margin of 23.7%. Historically, the average return on invested capital is 16.7% with a debt equity ratio of .23. This also indicates a 168% average price to earnings ratio that is remarkably outperforming making their stock performance not only consistent but recommendable with confident expected returns (Forbes, 2011).
- Trend Analysis
Based on key figures of Amazon, the future prospects are promising as the company will be able to continue to profit from its current business model. Their earnings will most likely come from their internationalization projects wherein they have a presence in key areas such as China, France and Japan. Furthermore, the company has a diverse range of businesses that relies on the technological advancements of e-commerce. This includes selling their ecommerce platform, development of EC2, S3 and SQS. Moreover, the companies other websites provide them with a multi-faceted presence in the Internet as they are offering search engines, advertising platforms, human task market place other than their more famous online retailing website. In this manner, the company is well prepared in the next five years to expand its e-commerce empire other than retail (Chaffey, 2011).
It is also important to note how Amazon has evolved as a company enabling them to utilize a business model than emphasizes on savings and internal investment. This strengthens their operational capacity by providing wider profit gaps and increased revenue streams. Analysts expect a strong performance in the next five to ten years based on their stock and consolidated financial information. It is more than likely that their stock prices will be coveted for its stability in the market especially since the future company initiatives are widely anticipated. This excites the investing public as the profit returns are ranked as commendable to any investment portfolio (McKinsey et al., 2010).
Bibliography:
Amazon.com Inc. (2011). Annual Report and Proxies. Amazon.com Retrieved November 2,
2011 from, http://phx.corporate-ir.net/phoenix.zhtml?c=97664&p=irol-reportsannual
Chaffey, D. (2011). E-Business and E-Commerce Management: Strategy, Implementation and Practice. New Jersey: Prentice Hall
Forbes (2011). Ratios and Returns Sprint Nextel Corp. Forbes.com Retrieved November 4,
2011 from
http://finapps.forbes.com/finapps/jsp/finance/compinfo/Ratios.jsp?tkr=AMZN
McKinsey & Company Inc., Koller, T., Goedhart, M. and Wessels, D. (2010). Valuation:
Measuring and Managing the Value of Companies, University Edition. New York: Wiley
Revsine, L. (2011). Financial Reporting and Analysis. New York:
McGraw-Hill/Irwin
Appendix Consolidated Financial Statements